Home Lab Testing – What to Test and How to Read Results
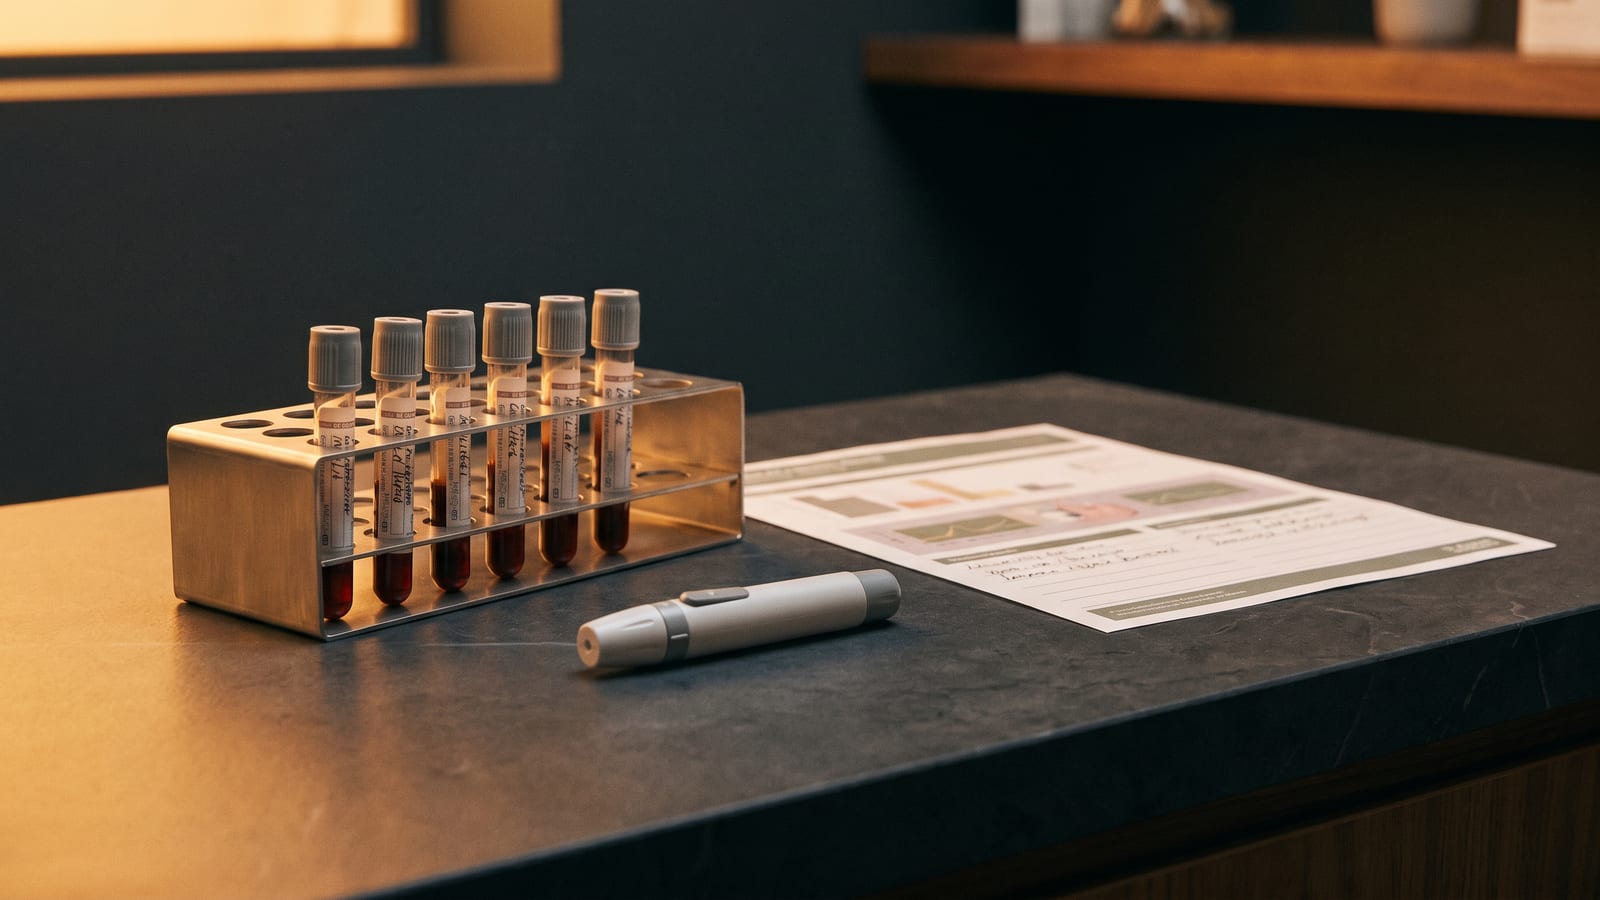
Blood work is the only biomarker data that does not lie. Heart rate variability tells you how you recovered from yesterday. Sleep scores are shaped by when you went to bed, not just your physiology. But a fasting lipid panel taken under standardized conditions is an objective snapshot of your cardiometabolic state, comparable to the same test run three months ago if you did the prep right. Home lab testing puts this kind of data in your hands without requiring a doctor’s order.
That comparability is the whole point. Doctors order lab tests to diagnose disease. Biohackers use them to build a personal baseline and track whether anything is actually changing. A single result tells you very little. A trend over twelve months, under consistent conditions, tells you whether your dietary changes moved the needle, whether that supplement protocol was worth the money, and whether something quietly brewing in your 30s is worth catching early.
This is what home lab testing makes possible.
What Home Lab Testing Actually Is
Direct-to-consumer lab testing covers two collection methods. The first is finger-prick self-collection: you get a kit in the mail, prick your finger, spot blood onto a card or into a small vial, and mail it to a CLIA-certified lab. The second is at-home venous draw, where a phlebotomist comes to you or you visit a partner draw site (Quest or LabCorp locations for most US services). Venous draw services send you to a physical location; you do not draw the blood yourself.
CLIA certification matters. It means the lab processing your sample meets federal quality standards for accuracy, precision, and proficiency testing. Any service worth using will prominently display their CLIA credentials. Skip services that do not.
Finger-prick convenience is real. You can order a kit on Tuesday and do the draw Wednesday morning without leaving your house. The accuracy trade-off is real too, and it is marker-dependent. A 2020 BMJ study found finger-prick samples produced reliable results for HbA1c, total protein, and CRP, but performed significantly worse for lipid panels and white blood cell counts due to tissue fluid contamination and hemolysis. If you are tracking lipids specifically, use a venous draw service or go directly to Quest or LabCorp.
Why Biohackers Use It Differently Than Everyone Else
Standard reference ranges are built from population data that includes people who are already sick. “Normal” cholesterol is the range where a doctor does not typically intervene. It is not the range where your cardiovascular risk is minimized. It is not the range associated with optimal athletic performance or longevity.
Your job as a biohacker is not to fall within the reference range. It is to find your own optimal range by testing consistently, tracking trends, and noting how your numbers respond to interventions.
This requires a different mindset than one-off clinical testing. One test is a snapshot. Serial testing under controlled conditions is data. The distinction matters because pre-analytical variation (what you ate, when you slept, whether you trained hard the day before) can move many biomarkers enough to swamp the signal from a real intervention.
The Biomarkers That Are Actually Worth Tracking
These are the markers that move reliably in response to lifestyle and supplement interventions, are measurable with standard home testing panels, and give you actionable information for the cost.
Cardiometabolic
ApoB is the single best lipid marker for cardiovascular risk assessment. It measures the total number of atherogenic lipoprotein particles. Unlike LDL-C, which estimates cholesterol content inside LDL particles, ApoB counts the actual particles carrying that cholesterol. Most people with cardiovascular events have “normal” LDL cholesterol but elevated ApoB. Target below 80 mg/dL if you are optimizing seriously; below 100 mg/dL is a reasonable starting point.
Fasting glucose (70-99 mg/dL fasting) and HbA1c (below 5.4% for most adults, 5.0-5.3% for active biohackers) give you glucose control context. HbA1c reflects your average blood sugar over approximately 120 days and is not affected by a single meal.
Fasting insulin is the marker most doctors do not order but should. Elevated fasting insulin is the earliest sign of insulin resistance, appearing years before fasting glucose rises. It responds to dietary changes within weeks, making it a useful intervention tracker.
Triglycerides above 100 mg/dL in a fasted state indicate excess carbohydrate intake relative to your metabolic flexibility. They move quickly with dietary changes, making them a good short-term indicator.
Inflammation and Organ Load
hs-CRP measures systemic inflammation. It is non-specific but useful: below 1.0 mg/L indicates low inflammatory burden, above 3.0 mg/L signals elevated inflammation worth investigating. It rises after intense training, infection, or alcohol intake, so standardize your draw conditions.
ALT, AST, and GGT assess liver stress. GGT is the most sensitive marker for alcohol intake and rises with high-dose supplement protocols. ALT and AST elevate with muscle damage or overtraining. If you are running a complicated supplement stack, these tell you whether your liver is handling it.
Creatinine and eGFR monitor kidney function. Relevant if you are supplementing creatine or running high-protein diets, as both increase creatinine temporarily.
Hormones and Micronutrients
TSH and free T4 screen for thyroid dysfunction. TSH is the first marker to rise when thyroid function declines. Most biohackers want TSH below 2.5 mIU/L.
Vitamin D (25-OH) is the standard test. Most indoor workers are deficient. Target 40-60 ng/mL for most biohackers; below 30 ng/mL is clinically deficient.
Ferritin reflects iron stores. Low ferritin causes fatigue and impairs endurance performance. High ferritin (above 200 ng/mL in men, above 150 ng/mL in women) indicates excess iron, which is pro-oxidant and associated with increased cardiovascular risk.
CBC (complete blood count) gives you red blood cell, white blood cell, and platelet counts. Useful for flagging anemia or infection that might explain fatigue or recovery issues.
Tests That Look Appealing but Are Weak for Tracking
Cortisol is highly variable throughout the day and affected by stress, light exposure, and food timing. A single cortisol reading tells you almost nothing. Most at-home cortisol tests measure morning salivary cortisol, which fluctuates enough to make serial comparison unreliable unless you are running a very controlled protocol.
Homocysteine is sensitive to recent B-vitamin intake, including multivitamins taken the morning of the test. If you supplement B vitamins, homocysteine will look better than your baseline. This makes it nearly useless for tracking without a washout period.
Heavy metal panels without a specific exposure concern are mostly noise. Blood heavy metals reflect recent exposure, not total body burden. If you have a legitimate exposure concern, work with a clinician who specializes in environmental medicine.
Many home testing services include these markers to appear extensive. They add cost and complexity without adding actionable signal for most people.
Accuracy: What the Research Says
BMJ evidence from 2020 established that finger-prick self-collection produces clinically acceptable results for HbA1c, total protein, and CRP when samples are processed by CLIA-accredited labs. For these markers, the convenience of home testing does not come at a meaningful accuracy cost.
The same study confirmed that finger-prick samples perform worse for lipid panels and complete blood counts. If you are tracking ApoB, LDL-C, HDL-C, or white blood cell counts, use venous draw. This is not a minor caveat. A misread lipid panel leads to incorrect conclusions about cardiovascular interventions, which is the opposite of useful.
CLIA-accredited labs processing venous samples produce results equivalent to hospital labs for standard biomarker panels. The regulatory framework for lab quality is the same regardless of whether the draw happened at a clinic or a partner site.
A 2018 NIH PMC review found that home self-testing kits generally show high user compliance and acceptable accuracy when users follow collection instructions. The operative phrase is “when users follow collection instructions.” Skipping the fast, not following the timing requirements, or collecting at the wrong time of day degrades the data before the sample reaches the lab.
How to Standardize Your Testing So the Data Is Usable
Without standardization, serial testing produces noise. Here is what consistent conditions require:
Use the same lab or service every time. Reference ranges differ between labs because calibration and measurement methods vary. Switching from InsideTracker to Quest between tests introduces a variable that has nothing to do with your health.
Fast for 8-12 hours before glucose, insulin, and lipid panels. Food intake directly affects these markers. A non-fasting lipid panel is nearly useless for tracking.
Draw at the same time of day. Cortisol and growth hormone vary throughout the day. For markers like TSH, morning draws produce the most consistent results because TSH has a diurnal rhythm.
Eliminate alcohol for 48-72 hours before the draw. Alcohol raises GGT, ALT, and triglycerides. A single night of drinking can elevate these markers enough to mislead your interpretation.
Skip intense training for 24-48 hours before the draw. Hard training elevates CRP, creatinine, AST, and ALT. Elevated AST and ALT after a hard workout are not liver damage; they are muscle turnover. Testing the day after leg day will make your liver markers look worse than they are.
Check specific test fasting requirements. Not all tests require fasting. Micronutrient panels, thyroid tests, and hormone panels are typically fine in a non-fasted state. Check your specific panel before you restrict eating unnecessarily.
Write these conditions down. When you schedule your next draw, pull up your last draw date and conditions and match them as closely as possible.
How Often to Retest
More testing is not better testing. Biomarkers move at the speed they move. Retesting too frequently catches measurement noise rather than real change.
Every 8-12 weeks during active intervention: HbA1c, fasting glucose, fasting insulin, ApoB, triglycerides, ALT, AST, hs-CRP. These respond to dietary and supplement changes within two to three months. If you are actively adjusting your diet, adding a supplement, or changing training, test these at 8-12 weeks to see if the intervention is working.
Every 6 months: Vitamin D, ferritin, and thyroid markers (TSH, free T4) unless you are in active treatment for a deficiency. These move more slowly and do not need frequent monitoring once stable.
Annually or less: Kidney function markers (creatinine, eGFR) and hormone panels if you are not actively treating a hormonal issue. These change slowly and testing more than annually adds cost without adding insight.
Every 3-4 months is reasonable for a full cardiometabolic panel if you are actively optimizing. Beyond that, you are paying for noise.
Choosing a Service: Who Each One Is For
These are the main players as of 2026, briefly characterized by their actual use case rather than a feature comparison.
Everlywell, Hims, LetsGetChecked: Good entry points. Broad biomarker coverage, easy ordering, at-home finger prick. Limited depth on any single marker. Best for someone getting their first set of labs who wants a low-friction experience. LetsGetChecked has international availability (US, UK, Ireland, Canada), which the others lack.
Superpower, SiPhox Health: Both offer approximately 100 biomarkers at the lowest annual cost (around $199/year). Superpower requires a lab visit for the venous draw. SiPhox uses at-home finger prick. These are the right choice if you are running quarterly serial panels and need to manage cost. The trade-off is less interpretive support.
Function Health: 100-130 biomarkers, $365/year, requires Quest or LabCorp visit. Best for someone who wants a full annual panel and is comfortable interpreting results themselves or with a clinician. The biomarker count is genuine, not padded with low-value markers.
InsideTracker Ultimate: 54 biomarkers, $489, strong app with personalized optimal zones based on your age, sex, and activity level. Built by a team with Harvard and MIT affiliations. The app interpretation is more sophisticated than competitors, which matters if you want guidance rather than just numbers. Worth the premium if you want the coaching-layer without ongoing clinician involvement.
DUTCH Panel: Urine-based hormone and cortisol testing. Not a replacement for blood panels. The gold standard for sex hormone metabolites and cortisol rhythm (four-point salivary cortisol curve). Relevant if you are optimizing hormones specifically, have suspected adrenal issues, or are running hormone replacement therapy.
GI-MAP, Viome, GlycanAge: These serve specific deep-dive use cases, not routine monitoring. GI-MAP is stool-based gut microbiome analysis. Viome offers gut and immune profiling. GlycanAge tests IgG glycans to estimate biological age, integrating genetic, epigenetic, and environmental factors. Useful for targeted investigation, not for serial tracking of the same marker.
What Home Testing Cannot Do
No at-home test replaces imaging. DEXA scans for body composition, MRI for organ health, and cardiac imaging for structural heart disease require clinical settings. A perfect lipid panel does not tell you whether you have coronary artery stenosis.
High-volume venous draws for specialized markers require clinical settings. Most home services cannot process high-volume blood or run specialty assays that need fresh plasma.
Prescription-required diagnostics are off-limits. If you need a fasting insulin test with a reference range calibrated for clinical diagnosis, a standard home panel may not use the same assay or calibration. Some markers need clinical interpretation in the context of symptoms.
If any result is significantly out of range, particularly for thyroid, liver, or metabolic markers, work with a clinician. Home testing is excellent for screening and trend tracking. It is not a substitute for medical evaluation of abnormal results.
A Practical Starting Panel
If you have never run labs on yourself, start here:
- HbA1c
- Fasting glucose and fasting insulin
- ApoB (or non-HDL cholesterol if ApoB is not available from your service)
- hs-CRP
- 25-OH Vitamin D
- TSH and free T4
- Ferritin
- CBC
Run this panel. Wait twelve weeks. Change one variable, whether that is diet, a supplement, or training. Retest. That is the actual biohacker methodology.
The goal is not a single perfect result. It is a trend line you can trust because the draw conditions were the same each time.
FAQ
Do I need a doctor to order these tests?
In most US states, no. Direct-to-consumer lab testing services operate without a physician order for standard biomarker panels. Some states restrict specific tests. Check your service’s state availability before ordering. If you have a known health condition or are on medication, work with your doctor to interpret results.
Are finger-prick tests accurate enough?
For HbA1c, CRP, and total protein: yes. For lipid panels and white blood cell counts: no. If the marker matters to you, use a venous draw or a LabCorp/Quest walk-in.
How do I know what is optimal versus just normal?
Normal means you are not obviously sick by population standards. Optimal means you are performing at a high level for your goals. Build your personal optimal range over time by tracking the same marker under consistent conditions. Most biohackers find their optimal ranges fall in the lower or upper portion of the standard reference range, depending on the marker.
My results are all “in range” but I feel terrible. What gives?
Standard reference ranges are built for diagnostic sensitivity, not performance optimization. Many biohackers feel best with hs-CRP below 1.0 mg/L, fasting insulin below 6 mIU/L, and vitamin D in the 40-60 ng/mL range, all within the standard range. This is exactly why trend data under standardized conditions matters more than any single result.